KPIs
A KPI turns one or more of a pipeline's metrics into a live tile: a value, a gauge, a graph or a status text. Each pipeline has its own KPIs, shown in its KPIs panel. The KPI section in the sidebar shows the KPIs of every running pipeline on the hub, and can be filtered by node and pipeline.
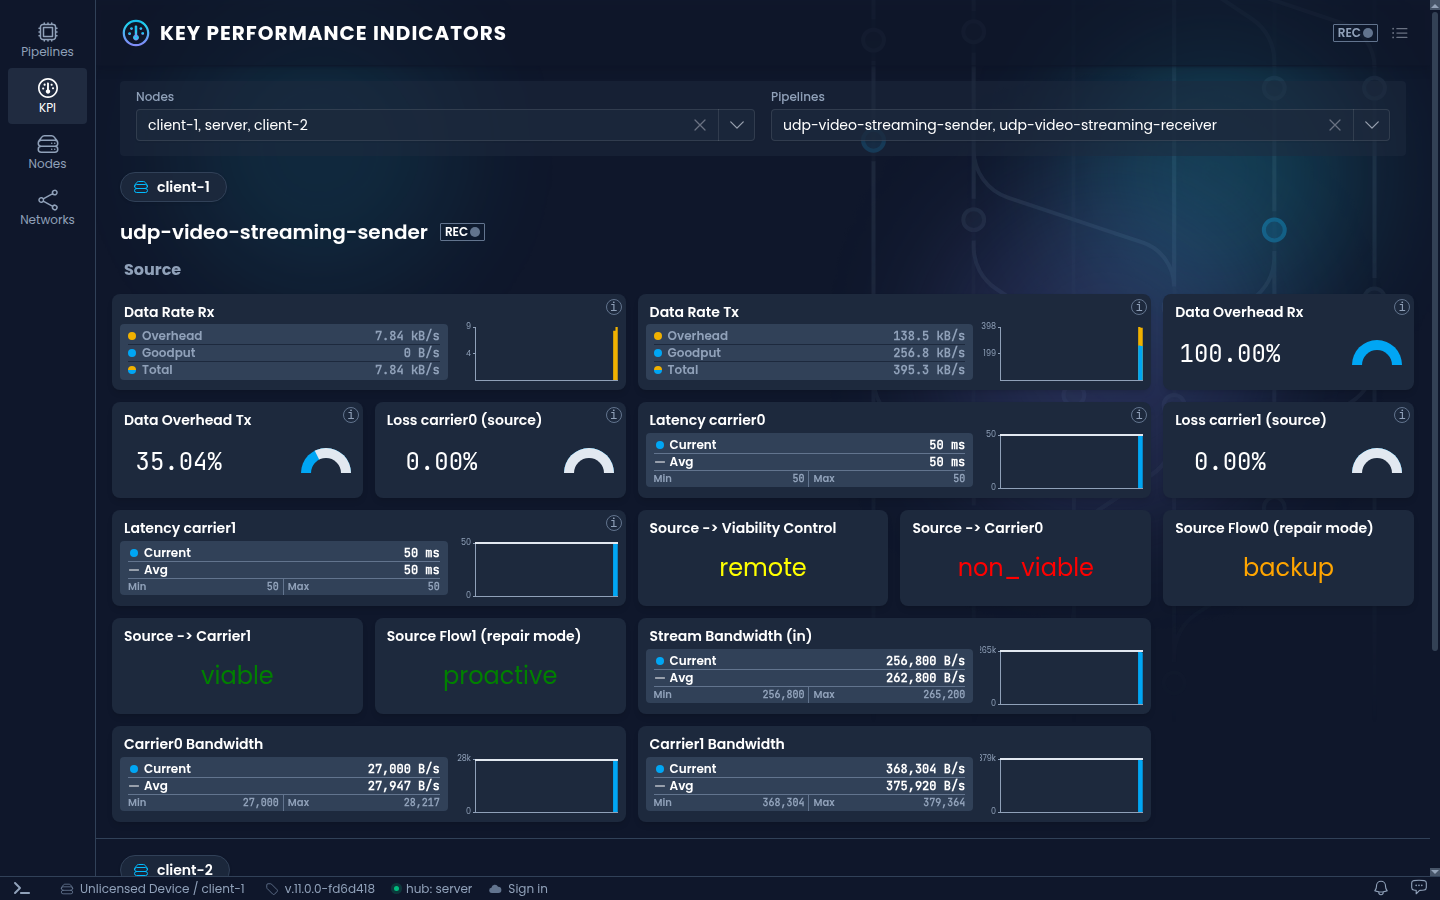
The pipelines made from templates come with KPIs for their data rates, overhead, loss and latency.
Add a KPI from a metric
The pipeline must be running, since the metrics come from the running pipeline.
- On the pipeline page, click Metrics in the header.
- Search for the metric, for example
link_trip. - Right-click the metric and choose Add as KPI.
- Pick the type of KPI and a label, and click Add.
- The KPIs panel opens with the new KPI and its settings. Adjust them, for example the unit, and click Save.
Add as KPI variable in the same menu gives the metric a name without adding a tile, so you can use it in the expression of any KPI.
Expressions and variables
A KPI shows the result of an expression. Expressions refer to metrics by variable names, and can combine them with arithmetic, such as source_stream_bw_in / 1000 or (1.0 - (goodput / total)) * 100. The KPI Variables list, opened with the (x) button in the KPIs panel, maps each variable to the path of its metric.
A variable that points at an enum metric holds the name of the value as a string, not its number. Compare it with the name in quotes, for example source_viability_control == "merged".
Record KPIs
Click REC in the KPIs panel, or on the KPI page, to record the KPIs over time.