The pipeline page
Click a pipeline in the Pipelines list to open its page. While it runs, the diagram shows how many packets pass each link, and the colors show where most of the traffic flows.
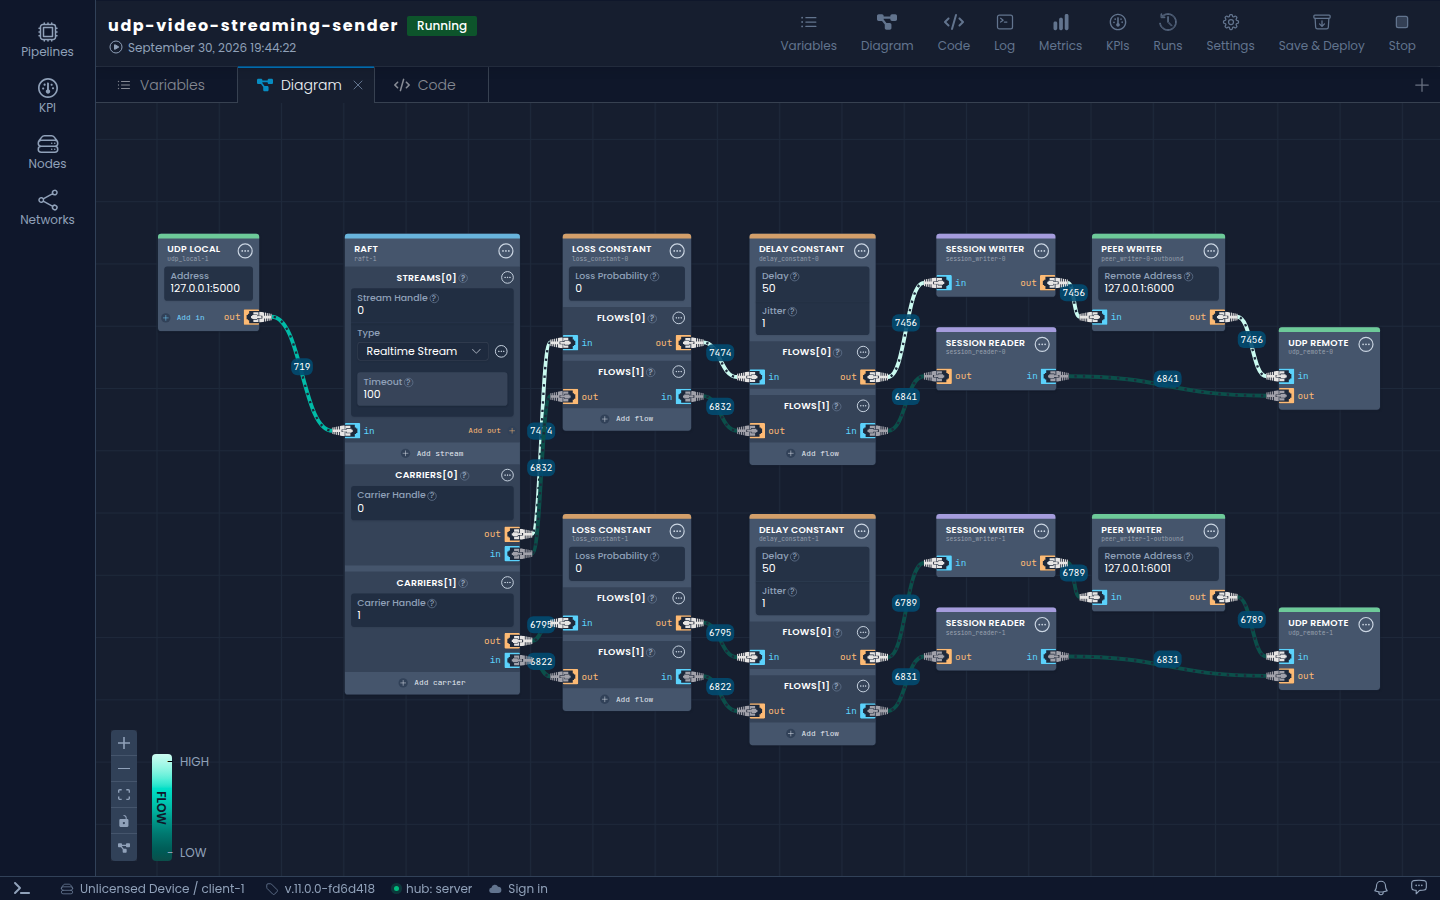
The header shows the pipeline's name, its status and when the current run started. The buttons on the right open panels and control the pipeline.
Panels
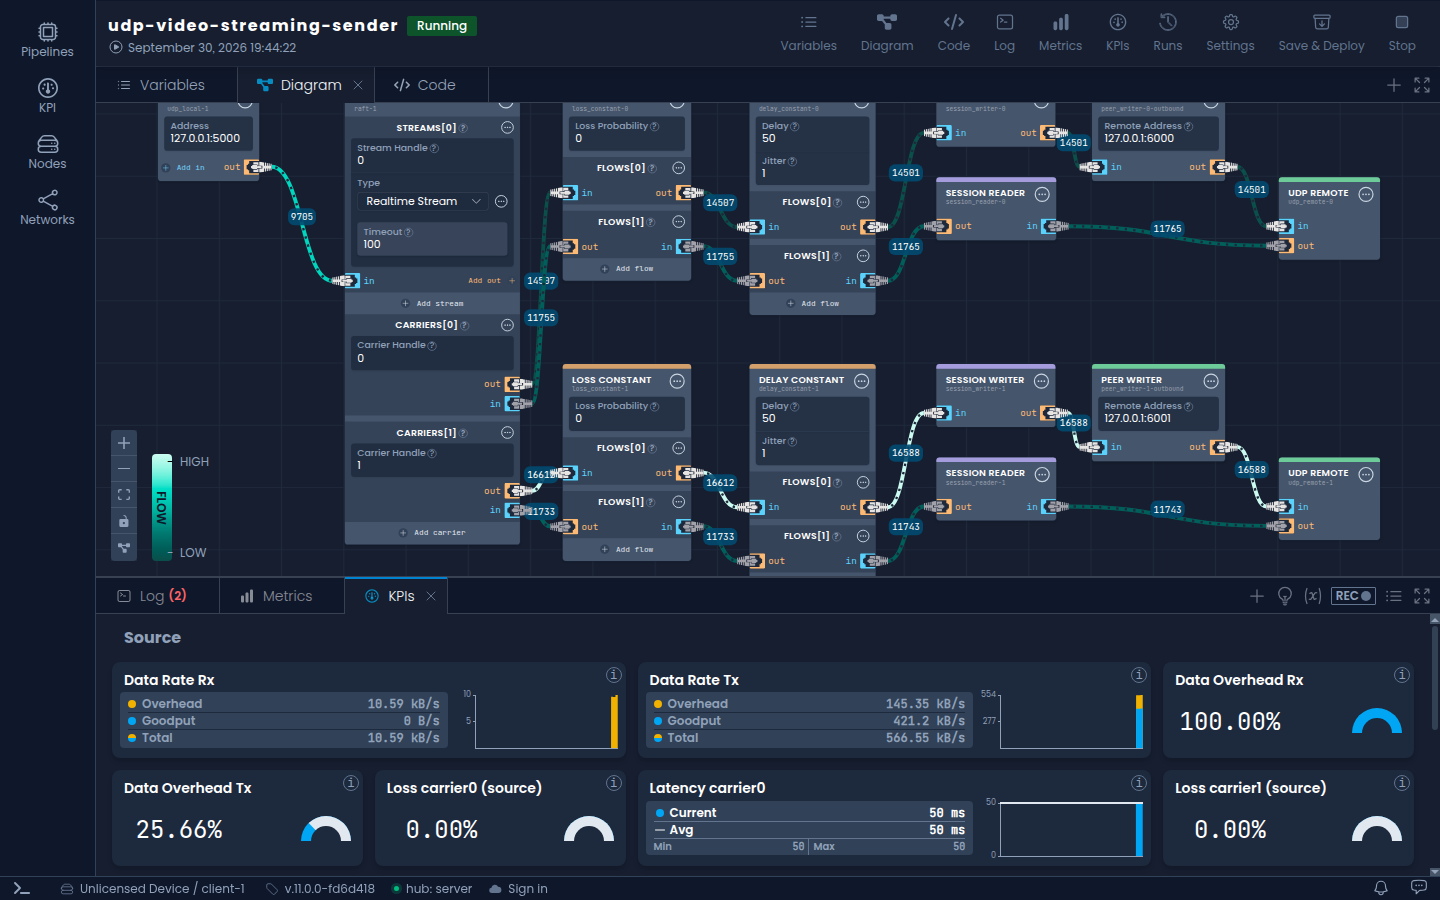
The page is made of panels. Open one with its button in the header. Drag a panel's tab to move it, for example next to the diagram or below it, and close it with its ×.
| Panel | What it shows |
|---|---|
| Variables | The pipeline's key settings as a simple form, such as delays or addresses, each tied to fields in the diagram. Change them and click Update. |
| Diagram | The components and how they connect. Edit fields in place. Right-click the canvas to add a component (or press Ctrl + Shift + A), and right-click a component to add optional fields, read about it or delete it. The buttons in the bottom-left corner zoom, fit the diagram to the panel and lay it out automatically. |
| Code | The pipeline as JSON. See the JSON schema. |
| Log | The log of the current run. Search and filter it, or download it. |
| Metrics | Every metric the running pipeline reports, as a searchable tree. Right-click a metric to watch it, add it as a KPI or copy its path. |
| KPIs | The pipeline's KPIs. |
| Runs | Every run of the pipeline, with its status and duration. Select an earlier run to see its log and metrics, or report it. |
| Settings | See Settings. |
Saving, starting and stopping
Changes to a pipeline are not applied until you save them. Until then the header shows Unsaved changes.
- Save stores a stopped pipeline.
- Save & Deploy stores a running pipeline and restarts it with the changes.
- Start and Stop start and stop the pipeline.
In the Pipelines list, each row also has a start or stop button, a toggle for auto start, and a ⋯ menu to Download, Duplicate, Copy to... another node, Export to library or Delete the pipeline.
Settings
| Setting | Description |
|---|---|
| Pipeline Name | The name shown everywhere in the dashboard. |
| Restart policy | Whether the pipeline restarts when its run ends: NEVER, ALWAYS or ON FAILURE. A pipeline you stop yourself stays stopped. |
| Startup policy | AUTO starts the pipeline when the node starts. MANUAL leaves it stopped. The auto start toggle in the pipeline list sets the same thing. |
| Log level | The least severe messages the pipeline logs. DEBUG and STATE log a lot and are meant for troubleshooting. |
| Instructions timeout (seconds) | How long the node waits for the pipeline to carry out an instruction before it counts as timed out. |
| CPU pin (zero indexed) | The CPU thread to run the pipeline on. Leave it empty to let NanoPing pick one. |
| Performance mode | Raises the scheduling priority and puts the CPU thread in its performance mode for lower latency. Linux only, on by default. |
Log level, CPU pin and performance mode apply to a running pipeline right away. The settings panel also has Download pipeline, Export to cloud library and Delete pipeline.